


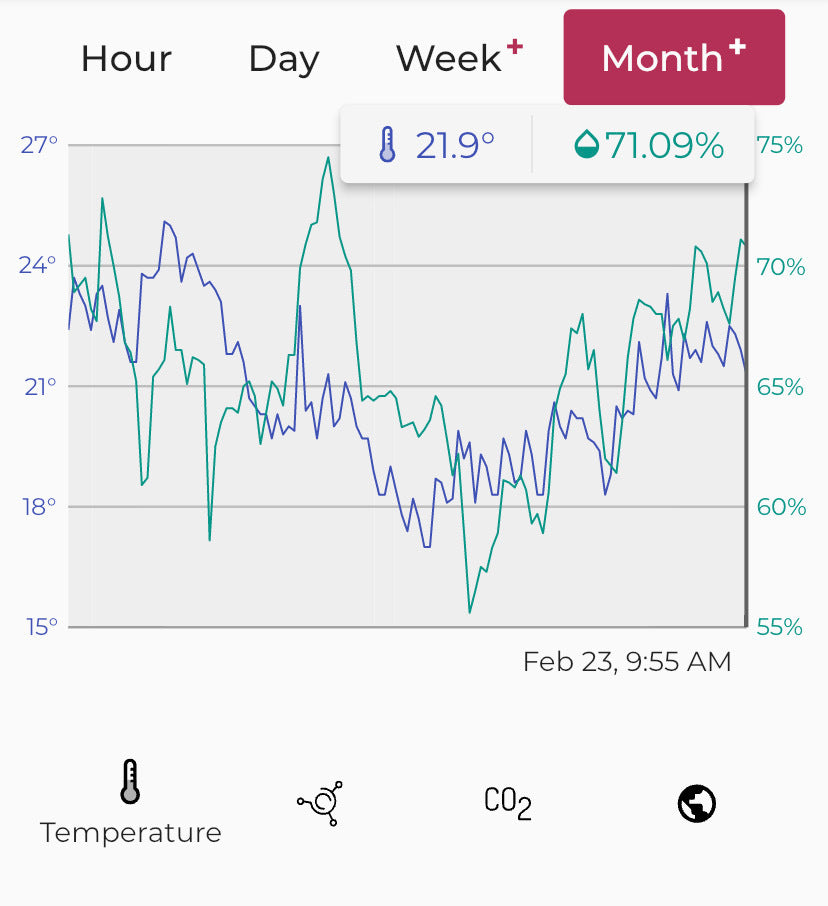
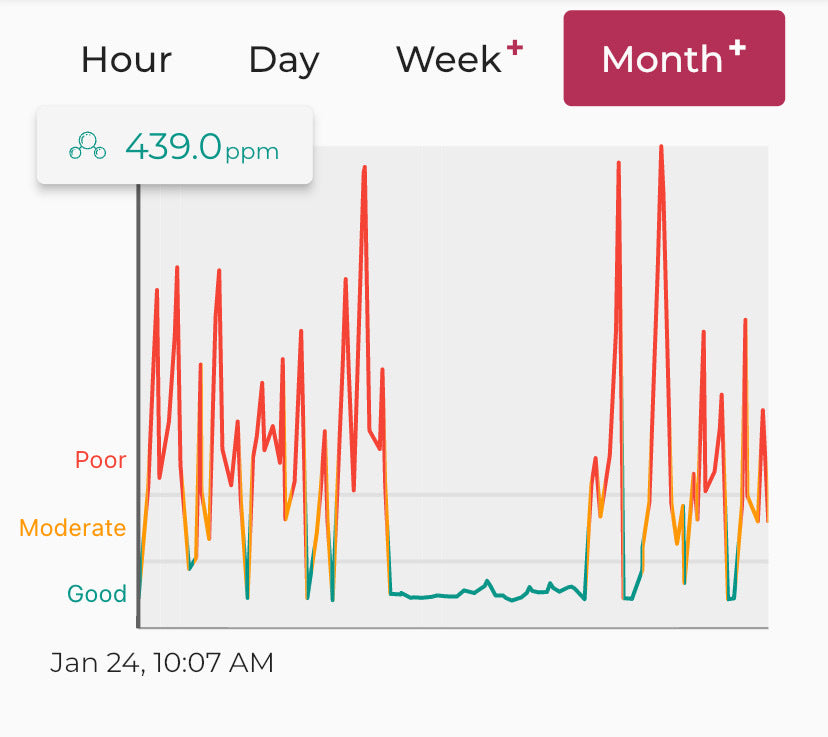
Extended Graphs & Logs
Have you been feeling sick lately? Not sure when it started? Track your home’s long-term air quality with the Sensibo Energy Saver Plan!
When it comes to managing your home's air conditioning, having access to accurate and detailed information is key. This can allow you to make better decisions about your AC usage.
Historical Logs
One of the most valuable features of Sensibo Energy Saver Plan is "Extended Graphs & Logs". This feature gives you access to weekly and monthly graphs of your room's temperature and humidity, so you can see how your AC usage is affecting the climate of your home.

Additionally, you'll be able to view historical user logs, which can help you understand how your AC usage has changed over time. Moreover, for users of Sensibo air quality products, including Air Pro and Elements, you can now track historical pollutant trends for your home.
Here are a few examples of how this feature can be put to use:
Identify Patterns
If you're trying to reduce your energy consumption, you can improve your comfort by scheduling your AC to turn on at the points of the day where your home is at its hottest or most humid. This can help you identify patterns and make adjustments to your usage to save money.
Track Your Air Quality
If you're trying to improve the comfort of your home climate, you can use the graphs and logs to track the humidity levels in your home. If the humidity is too high, you can use your AC to remove excess moisture, limit mold growth, and improve the air quality.
Overall, Sensibo the Energy Saver Plan is a great investment for anyone looking to make better decisions about their AC usage. With extended graphs and logs, you'll be able to track your room's temperature and humidity, and understand how your home retains temperature.
So why wait? Sign up for Sensibo Energy Saver Plan today and start making better decisions about your home's air conditioning.